
Sim racing telemetry: the 5 graphs that drive progress
August 1, 2026 · Driver Notes · Telemetry · Academy
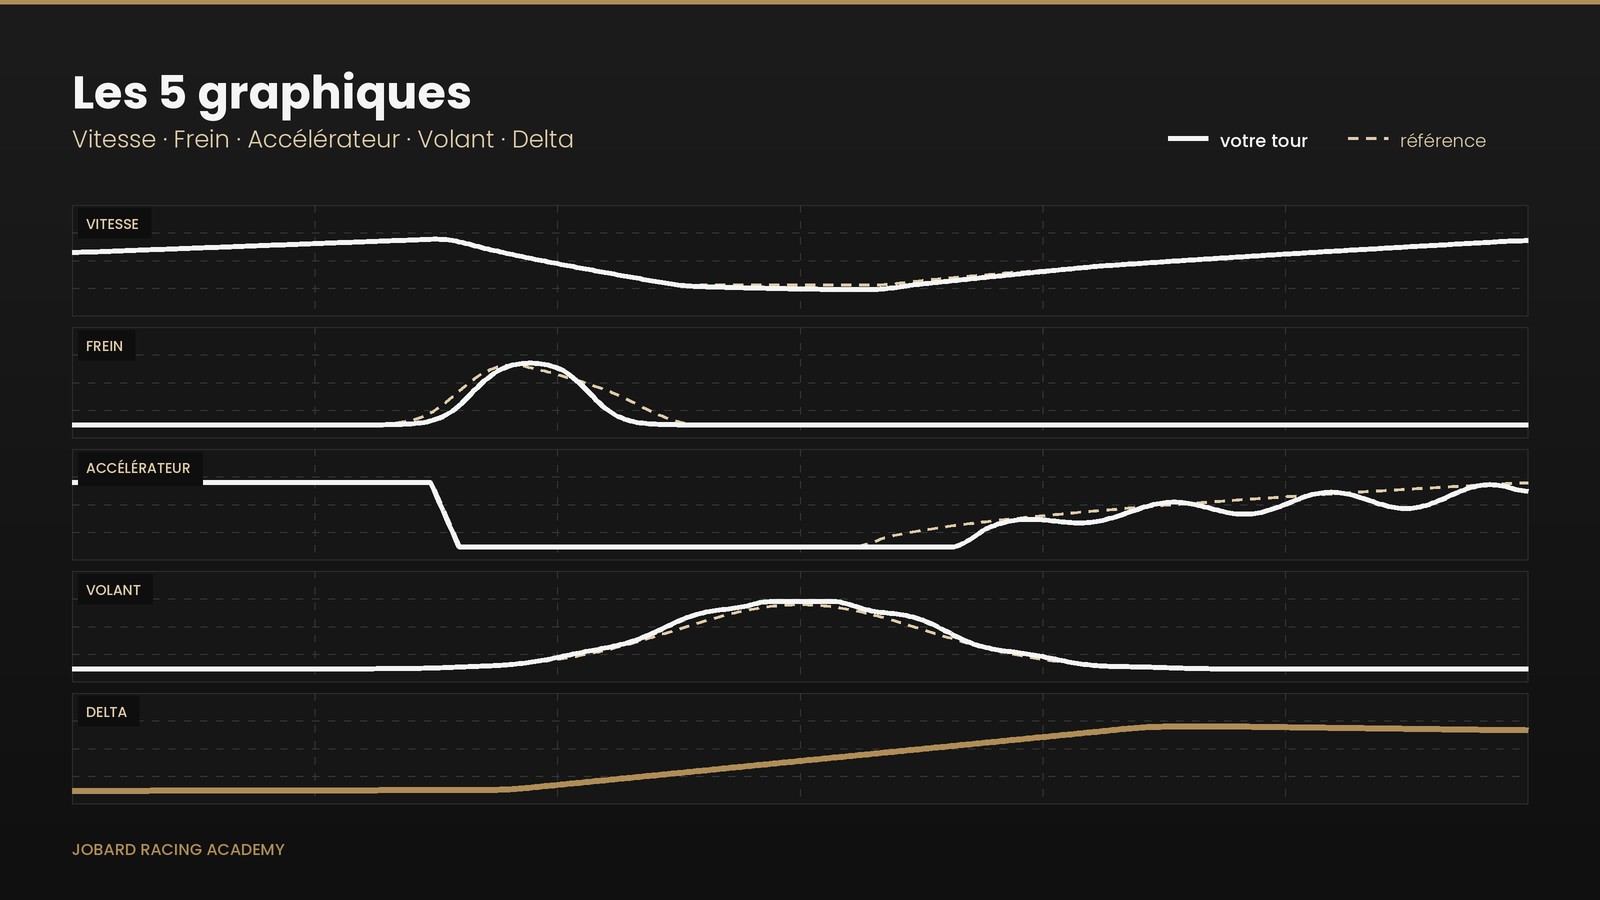
Sim racing telemetry is, wrongly, a source of apprehension. One imagines black screens covered in curves, engineering software and hours of analysis. The reality is simpler: a quick lap can be read across five graphs. Speed, brake, throttle, steering angle, delta. Learn to read them, and you stop feeling your mistakes and start seeing them. That is precisely the leap that separates the driver who stagnates from the one who improves, round after round.
Why five graphs are enough
You do not need to master MoTeC i2 or know thirty channels. A beginner in telemetry analysis progresses faster by reading five curves correctly than by opening fifty at random. The JOBARD method rests on this principle: fewer channels, but read in the right order and always compared against a reference — your best lap, a faster team-mate's, or a benchmark lap.
Each graph answers a precise question. Taken together, they tell the story of your lap better than any sensation could. Data does not lie, does not take offence and does not flatter you: it tells you where you are losing time, corner by corner. The rest is simply method.
1. Speed — the backbone of the lap
The speed trace is the first to read, because it summarises everything else. Overlay yours against your reference and look at two things: minimum speed through the corner — your speed at the apex — and maximum speed at the end of the straight.
Wherever your trace falls below the reference, you are losing time. A lower trough at the apex means you have braked too much, or turned in too early. A lower top speed on the straight almost always betrays a poor exit from the previous corner. Speed does not yet tell you why — it tells you where. That is your starting point: identify the largest gap, then look into the following graphs to explain it.
2. Brake — where tenths are won and lost
Braking is where a methodical driver gains the most time, and where the beginner loses the most. The brake pressure trace tells three things: where you brake, how hard, and how you release.
A good braking event rises quickly to its peak pressure, then releases progressively as the apex approaches — this is trail braking, easing off the brake while turning. On the trace, this produces a sharp rise followed by a smooth descent, not a staircase step. If your pressure drops suddenly, you are releasing the brake too early and the car stops rotating. If it plateaus while speed collapses, you are locking up. Compare your braking point to the reference: braking five metres too early, corner after corner, costs half a second per lap without you ever feeling it.
3. Throttle — the exit before the straight
The throttle trace is read as the mirror of the brake: what matters is the moment you return to full throttle. An early, progressive application of the throttle on the way out of a corner pays dividends along the entire following straight, because the smallest advantage compounds with speed.
Look for two classic faults. The first: hesitation — a mid-travel plateau where you sit at 60 % waiting to "feel sure" — every tenth spent there is lost. The second: on–off application, a brutal return to throttle that unsettles the rear and forces you to lift. The correct trace is a clean but controlled rise, timed just past the apex. If your reference is already at full throttle while you are still hesitating, you have found the explanation for the top-speed deficit identified on the first graph.
4. Steering angle — the mirror of your line
Steering angle is the most honest graph regarding your line. In theory, a clean corner is taken with a single movement: turn in, hold, unwind. The ideal trace resembles one smooth, continuous arc.
In practice, a beginner's trace often looks like a saw blade: constant small corrections. Each one scrubs speed and unsettles the car. Excessive angle signals understeer that you are compensating for by applying more lock — the car pushes wide and you "force" the wheel. Reading this trace teaches you to enter more slowly but more precisely, and to understand that at the wheel, the less you correct, the faster you go.
5. Delta — the final arbiter
The delta is the graph that settles the matter. It displays, at every moment of the lap, your advantage or deficit relative to the reference. When the curve rises, you are losing time; when it falls, you are gaining. At a glance, you know which corner is truly costing you time, and which one you already have under control.
It is also the graph that prevents the most common mistake: working on the wrong corner. We all have the impression of losing time in the spectacular long sweeper, when the delta shows that the real leak is in the slow chicane just before it. Read the delta first after every session: it tells you where to focus your attention. The other four graphs will tell you what to correct.
The method for reading these graphs without drowning in data
Order is everything. After a session, open the delta and identify the corner where you are losing the most time. Then go deeper into that single corner: speed to locate the gap, brake for the braking point and trail-off, throttle for the exit, steering for the cleanliness of the input. One cause, one correction. You return to the sim, change one thing only, and measure again. It feels slow at first, then becomes a ten-minute reflex.
You do not need engineering software to get started. The telemetry built into your simulation, or a simple analysis template, is sufficient to read these five traces. A MoTeC beginner need not explore the entire interface: they need the right channels, displayed in the right order, with a reference alongside. That is precisely what we have systematised within the race team's method — and what JOBARD Race Engineer calculates automatically, with its benchmark delta, for our drivers.
Key takeaways - Read the delta first: it tells you where you are losing. The other graphs tell you what to correct. - Speed, brake, throttle, steering: one cause per corner, one correction at a time. - Always compare against a reference. A single trace means nothing; two overlaid traces say everything.
Data does not replace the driver — it brings clarity. That is the difference between driving a great deal and genuinely improving.
Reading your data like an engineer: the Telemetry Guide →
To understand how the braking ramp described above is built, read also Trail braking: braking later is not enough.
To go further, join the community on Discord and share your traces.
In brief
Do you need paid software for sim racing telemetry? Not to begin with. The telemetry built into your simulation or a simple analysis template is sufficient to read the five graphs. An advanced tool becomes useful later, once the method is established.
Which graph should you start with? Always the delta. It isolates the corner where you are losing the most time and prevents you from working on the wrong place.
How long before an analysis becomes useful? Ten to fifteen minutes after a well-focused session. One corner corrected properly is worth more than an entire lap skimmed over.
What exactly is trail braking? Releasing the brake progressively while turning, rather than releasing it all at once before steering. On the brake trace, this produces a smooth descent after the pressure peak.
Read next
Assetto Corsa EVO safety rating: proximity that pays
In Assetto Corsa EVO, the safety rating no longer simply penalises contact — it rewards the time spent wheel to wheel without touching.
August 18, 2026Read →Trail braking: braking later is not enough
Braking later does not save time. Trail braking — progressively releasing the brake as you turn in — loads the front axle and frees up earlier acceleration.
August 1, 2026Read →Circuit apex: the painted kerb is slowing you down
The painted marker at the edge of the track is a layout reference, not a driving instruction. Targeting that geometric apex costs you exit speed — and exit speed is paid back across every metre of the straight that follows.
September 19, 2026Read →